


XBRUSD – Chart Pattern – Channel Up
XBRUSD is heading toward the resistance line of a Channel Up pattern and could reach it within the next 2 days. It has tested this line numerous times before, and this time may be no different, ending in a rebound instead of a breakout. If a breakout doesn’t occur, we could see a retracement back […]

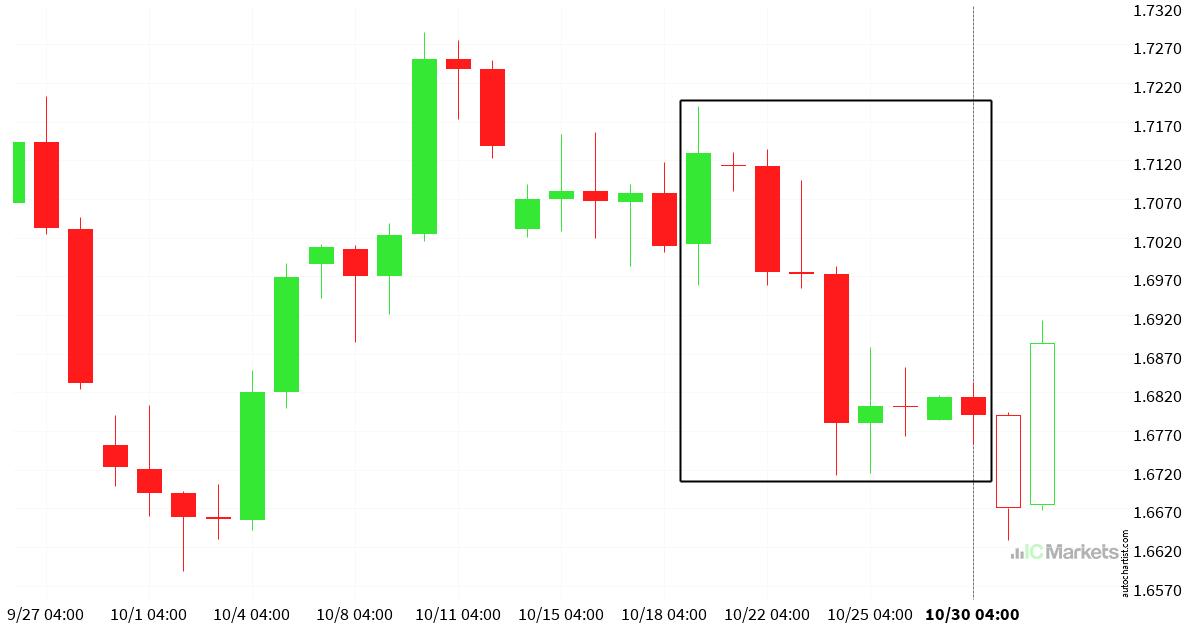
BIIB – Key Level – Resistance
BIIB is moving toward a resistance line. Because it has retraced from this level in the past, we may see either a breakout through this line or a rebound to current levels. It has touched this line multiple times over the last 9 days and may test it again within the next 9 hours. *** […]

HK50 – Chart Pattern – Falling Wedge
HK50 is heading toward the support line of a Falling Wedge pattern and could reach it within the next 12 hours. It has tested this line numerous times before, and this time may be no different, ending in a rebound instead of a breakout. If a breakout doesn’t occur, we could see a retracement back […]

USDCHF – Big Movement
An unexpectedly large move occurred on the USDCHF 1 hour chart, starting at 0.80493 and reaching 0.7995. It stands out in recent trading activity. *** Risk Warning: Trading in securities involves significant risk. Prices may fluctuate and securities may become valueless. Losses may exceed deposits. These products are complex and require appropriate knowledge.

UNH – Key Level – Resistance
UNH is approaching a critical level that could be a key deciding factor for what comes next. We may see this trajectory continue to test and break through 336.9050, unless it loses momentum and pulls back to current levels. *** Risk Warning: Trading in securities involves significant risk. Prices may fluctuate and securities may become […]

XAUUSD – Chart Pattern – Channel Up
XAUUSD is moving toward a resistance line. Since it has retraced from this line before, we may see either a breakout through it or a rebound to current levels. It has touched this line multiple times in the past 15 days and may test it again within the next 3 days. *** Risk Warning: Trading […]
EURGBP – Big Movement
EURGBP has moved lower by 0.46% from 0.88025 to 0.876225 in the last 17 hours. *** Risk Warning: Trading in securities involves significant risk. Prices may fluctuate and securities may become valueless. Losses may exceed deposits. These products are complex and require appropriate knowledge.

USDJPY – Key Level – Support
USDJPY has broken through a support line. Because it has previously retraced from this price, you should wait for confirmation of the breakout before trading. It has touched this line multiple times over the past 3 days, which suggests a possible target around 154.9228 within the next 14 hours. *** Risk Warning: Trading in securities […]

EURUSD – Chart Pattern – Channel Up
EURUSD is heading toward the resistance line of a Channel Up pattern and could reach it within the next 12 hours. It has tested this line numerous times before, and this time may be no different, ending in a rebound instead of a breakout. If a breakout doesn’t occur, we could see a retracement back […]

BIIB – Key Level – Resistance
The price of BIIB is heading back toward the resistance area. It may struggle to break through and could reverse direction. The price may eventually break through, but it typically retreats from the level several times before doing so. *** Risk Warning: Trading in securities involves significant risk. Prices may fluctuate and securities may become […]